

Understanding Expected Move and Expiration Cone in Options Trading
What is Expected Move in Options Trading?
The expected move is one of the most powerful yet underutilized tools in an options trader's arsenal. It represents the projected price range where a stock is statistically likely to trade by option expiration, based on current implied volatility. This metric transforms abstract volatility numbers into actionable price levels that help traders make better decisions about strike selection, position sizing, and risk management.
Understanding expected move is the difference between gambling on options and trading with mathematical edge. It answers the critical question every options trader must ask: How far could this stock realistically move before my contract expires?
How Expected Move is Calculated
The expected move formula derives from implied volatility and time remaining until expiration:
Expected Move = Stock Price × Implied Volatility × √(Days to Expiration / 365)
This calculation provides a one standard deviation range, which has approximately 68% probability of containing the stock price at expiration. In practical terms:
68% probability: Stock stays within ±1 standard deviation
95% probability: Stock stays within ±2 standard deviations
99.7% probability: Stock stays within ±3 standard deviations
For example, if a stock trades at $50 with an expected move of $5, there's roughly a 68% chance it will be between $45 and $55 at expiration. This probabilistic framework is what separates professional options traders from amateurs.
The Expiration Cone Explained
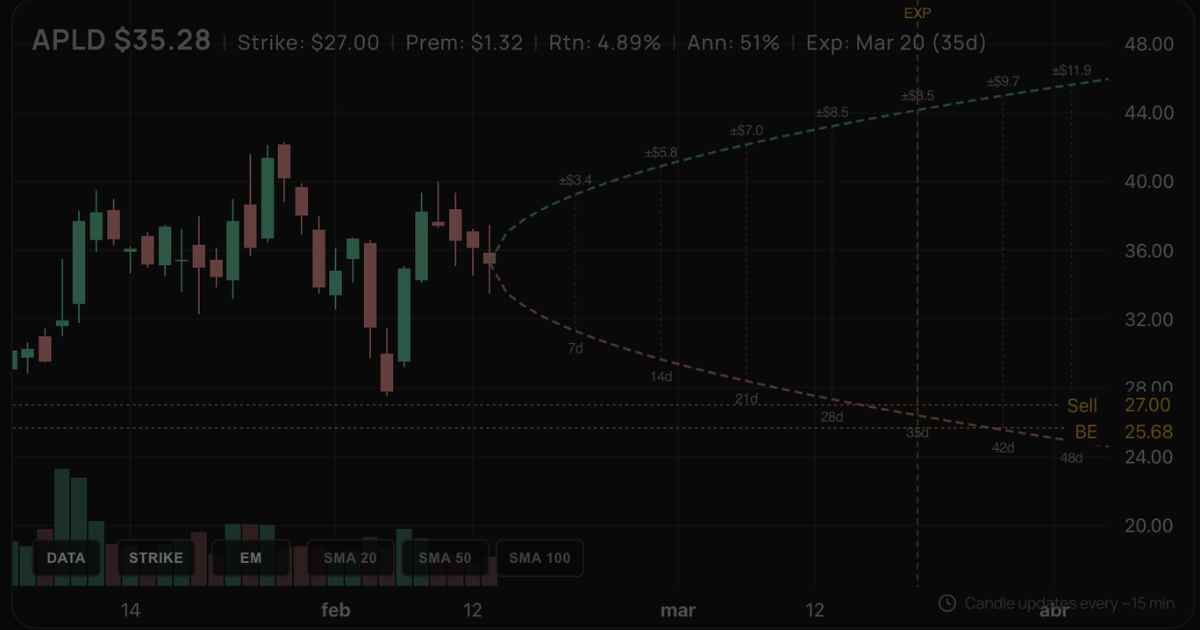
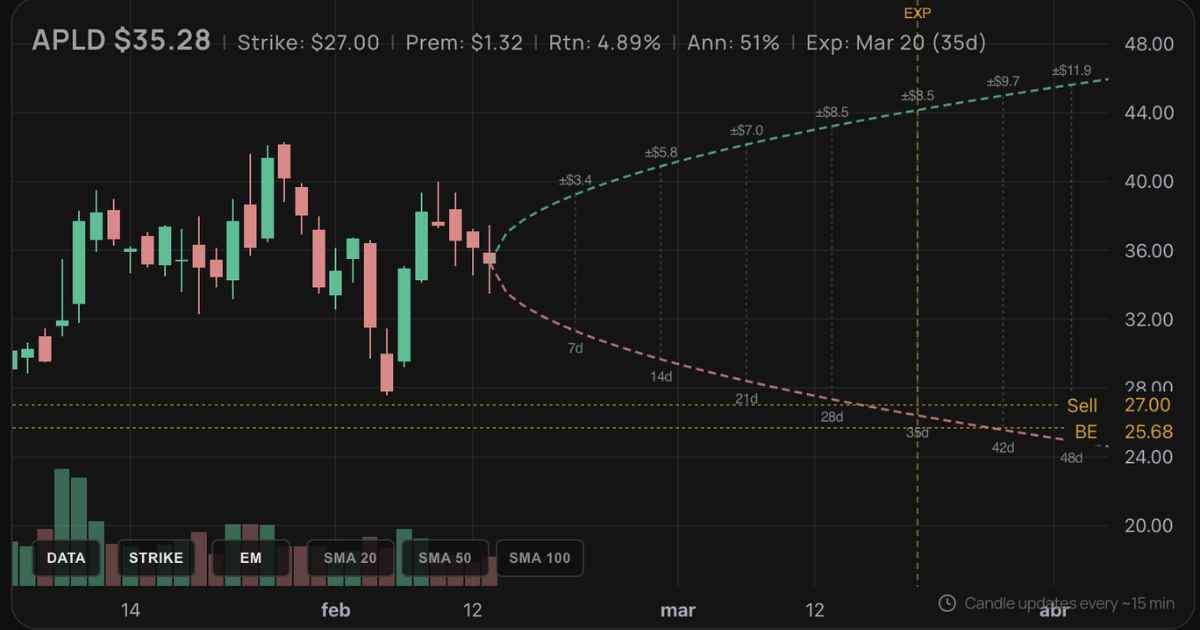
The expiration cone (also known as volatility cone or probability cone) is a visual projection that illustrates how potential price movement expands as you look further into the future. Imagine a cone extending from today's price point - the further out you project, the wider the range of potential outcomes.
Why the Cone Shape?
The cone shape reflects a fundamental truth about markets: uncertainty compounds with time. While you might reasonably predict where a stock could be tomorrow, predicting its location in 60 days involves exponentially more variables. This expanding uncertainty is why:
Longer-dated options command higher premiums - more time = more uncertainty = more value
Theta decay accelerates near expiration - as the cone narrows, time value evaporates faster
Short-term predictions are more reliable - the narrow part of the cone has tighter boundaries
Components of the Expiration Cone
When viewing an expiration cone visualization, you'll typically see:
Upper Boundary: A projected line showing the upper range of expected movement at different time intervals. This represents where the stock has approximately 16% probability of trading above (one standard deviation).
Lower Boundary: The downside projection showing potential support levels with similar probability distribution.
Time Markers: Regular intervals (7d, 14d, 21d, 28d, etc.) showing how the expected move expands as time increases.
Strike Price References: Horizontal lines indicating specific option strikes relative to the probability cone, helping traders visualize if their chosen strike sits inside or outside the expected range.
Reading the Expiration Cone Chart
Understanding what you're seeing in an expiration cone chart is crucial for applying this tool effectively:
The Widening Effect
Notice how the cone starts narrow at the current date and progressively widens. Each step forward in time shows larger price projections both up and down. This widening isn't arbitrary - it's mathematically derived from implied volatility and the square root of time.
Critical Price Levels
The cone intersects with various price levels that have strategic significance:
Inside the cone: Options strikes within this range have higher probability of being tested
At the boundaries: One standard deviation strikes - the "sweet spot" for many neutral strategies
Outside the cone: Low-probability strikes that may offer attractive premium for sellers
Time Decay Visualization
As expiration approaches, you can visualize how the cone narrows. This narrowing represents decreasing uncertainty and accelerating theta decay. Options sellers benefit from this compression, while buyers fight against it.
Practical Applications for Options Traders
Premium Selling Strategies
For traders selling cash-secured puts, covered calls, or credit spreads, the expiration cone is invaluable:
Strike Selection: Choose strikes outside the expected move boundaries to increase probability of profit. If selling a put, select a strike below the lower boundary. For calls, select above the upper boundary.
Risk Assessment: Even if a strike appears "safe" at first glance, the cone shows you exactly how much room exists before that strike gets challenged. This helps determine appropriate position sizing.
Time Frame Optimization: Shorter expiration cycles show narrower cones, meaning tighter ranges and potentially higher probability of success (though lower absolute premium).
Supercharge your trading with Scanorix
Want to find the best options? Scanorix scans thousands of contracts for you.
Directional Trading
For traders with directional bias:
Validating Your Thesis: If you're bullish, check whether your target price sits inside or outside the expected move. Targets well outside the cone may be unrealistic within the given timeframe.
Entry Timing: Wide cones (high IV) mean expensive options. Narrow cones (low IV) mean cheaper options but less projected movement. Finding the balance is key.
Profit Target Setting: Use the expected move to set realistic profit targets. Taking profits at 50% of max gain when you're at the edge of the expected move is often smarter than holding for max profit.
Volatility Trading
Advanced traders use expiration cones for volatility arbitrage:
IV Expansion/Contraction: Before earnings or major events, IV spikes and the cone expands dramatically. After the event, it collapses. Traders can sell inflated premium before events or buy cheap options in low IV environments.
Comparative Analysis: Compare the expected move to historical move averages. If the expected move is significantly larger than typical realized movement, premium may be overpriced - an opportunity to sell.
Expected Move Accuracy and Limitations
Understanding Probability vs. Certainty
The expected move represents statistical probability, not a guarantee. Roughly one-third of the time (32%), stocks will move beyond the one standard deviation range. This is normal and expected. Understanding this prevents false confidence.
Black Swan Events
Market crashes, unexpected earnings surprises, FDA approvals, and geopolitical shocks can cause moves far exceeding any statistical expectation. The expected move assumes normal market conditions and continuous pricing.
Implied vs. Realized Volatility
The expected move uses implied volatility - what the market expects. This doesn't always match realized volatility - what actually happens. Sometimes the market overestimates movement (high IV, low realized), creating opportunities for premium sellers. Other times it underestimates, benefiting option buyers.
Advanced Expected Move Strategies
Two Standard Deviation Approach
Conservative traders often reference two standard deviation moves (95% probability range). This provides more cushion but results in strikes further from current price, meaning less premium collected or more capital required.
Earnings Expected Move
Before earnings, options prices spike as uncertainty increases. The expected move before earnings often represents just the earnings day move, not the entire time to expiration. Specialized earnings strategies leverage this concentrated volatility.
Rolling Positions
As expiration approaches and the cone narrows, traders can roll positions to new expirations with wider cones, maintaining distance from the current price while collecting additional premium.
Integrating Expected Move with Technical Analysis
The expiration cone shouldn't exist in isolation. Combine it with:
Support and Resistance: Where do the cone boundaries align with technical levels? If the lower boundary sits at major support, you have confluence increasing probability of success.
Moving Averages: Does the expected move extend beyond key moving averages that often act as dynamic support/resistance?
Volume Profile: High volume nodes often act as magnets. If they sit at expected move boundaries, they may define actual price action.
Trend Analysis: An uptrending stock may consistently trade in the upper half of its expected move cone, while downtrending stocks favor the lower half.
Common Mistakes to Avoid
Treating Expected Move as a Price Target
The expected move is a probability range, not a prediction. Don't assume the stock will trade to the edges of the cone.
Ignoring the One-Third Rule
Remember: approximately 32% of the time, stocks exceed the one standard deviation expected move. Build this into your risk management rather than being surprised by it.
Over-Relying on Historical Patterns
Past expected move accuracy doesn't guarantee future results. Market regime changes, volatility spikes, and structural shifts can alter how reliable these projections are.
Forgetting Early Assignment Risk
For short options positions, even if your strike is outside the expected move, early assignment can occur if the option goes in-the-money before expiration.
Tools and Resources
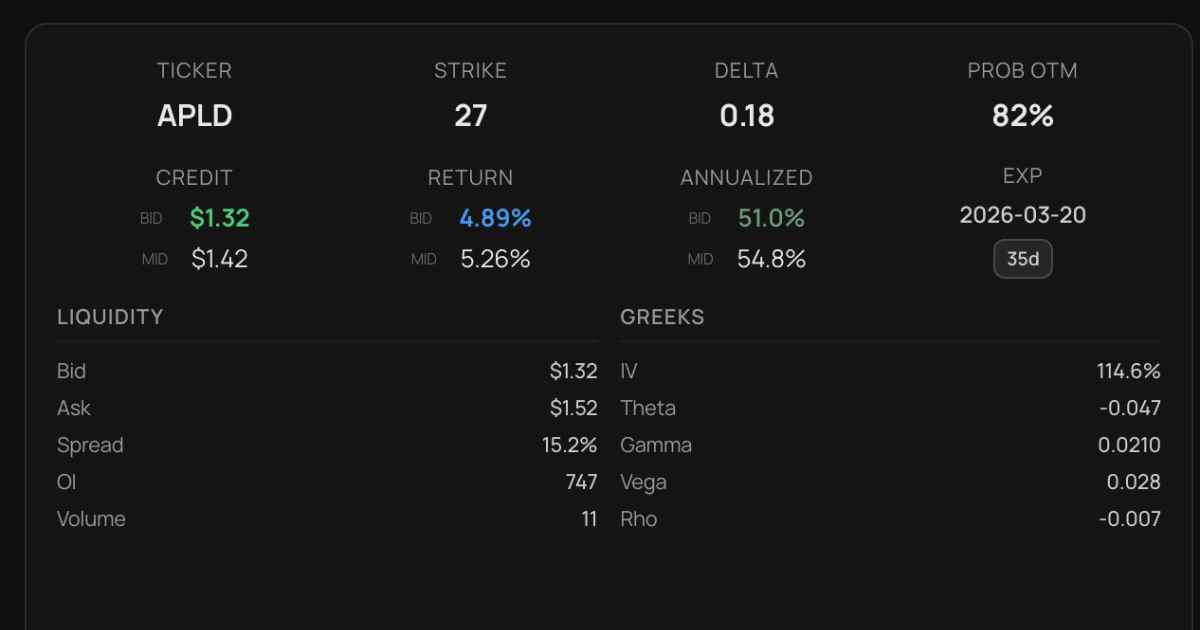
Most modern options platforms provide expected move calculations:
Thinkorswim: Shows expected move on options chains
Tastyworks: Displays expected move prominently for quick reference
Interactive Brokers: Provides probability cones in their analytics tools
Options pricing calculators: Allow manual calculation when platform data isn't available
Conclusion: Mastering Probability-Based Trading
The expected move and expiration cone transform options trading from speculation into probability management. By understanding where stocks are statistically likely to trade, you gain several critical advantages:
- Better strike selection based on mathematical edge rather than guesswork
- Improved risk management through visual representation of potential outcomes
- Enhanced position sizing aligned with probability of success
- Realistic profit targets that match statistical expectations
- Timing optimization for entries and exits based on cone width
The key to long-term success isn't predicting the future - it's consistently putting probability on your side. The expected move and expiration cone are tools that help you do exactly that, trade after trade, turning the complex mathematics of options pricing into clear, actionable trading decisions.
Remember: in options trading, you don't need to be right every time. You just need to be right more often than the probabilities suggest, or structure trades where even when you're wrong, losses are controlled and manageable. The expected move and expiration cone are your roadmap to achieving exactly that.
Stop Hunting for Trades. Start Screening with Scanorix
Multi-strategy options screener. Advanced filtering. Integrated technical analysis.